Load the R packages we will use
Question: Modify the code for comparing different sample sizes from the virtual bowl
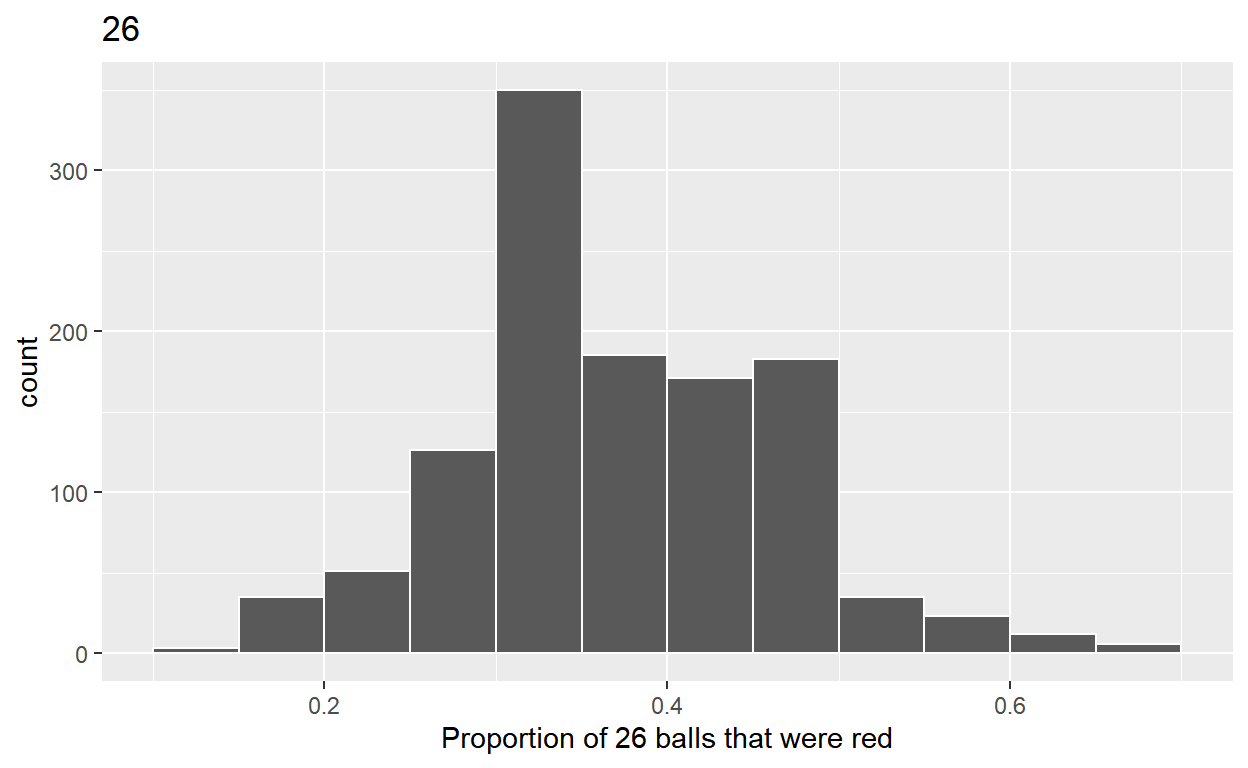
Segment 1: Sample size = 26
1A.
Take 1180 samples of size 26 instead of 1000 replicates of 25 from the
bowldataset.Assign the output to
virtual_samples_26
virtual_samples_26 <- bowl %>%
  rep_sample_n(size = 26, reps = 1180)
1B.
Compute the resulting 1180 replicates of proportion Red.
Start with
virtual_samples_26THENgroup_byreplicate THENCreate variable red equal to the sum of all the red balls
Create variable
prop_redequal to the variable red/26Assign the output to
virtual_prop_red_26
1C.
Plot distribution of
virtual_prop_red_26via a histogramUse labs to:
label x-axis = “Proportion of 26 balls that were red”
create title = “26”
ggplot(virtual_prop_red_26, aes(x = prop_red)) +
  geom_histogram(binwidth = 0.05, boundary = 0.4, color = "white") +
  labs(x = "Proportion of 26 balls that were red", title = "26")
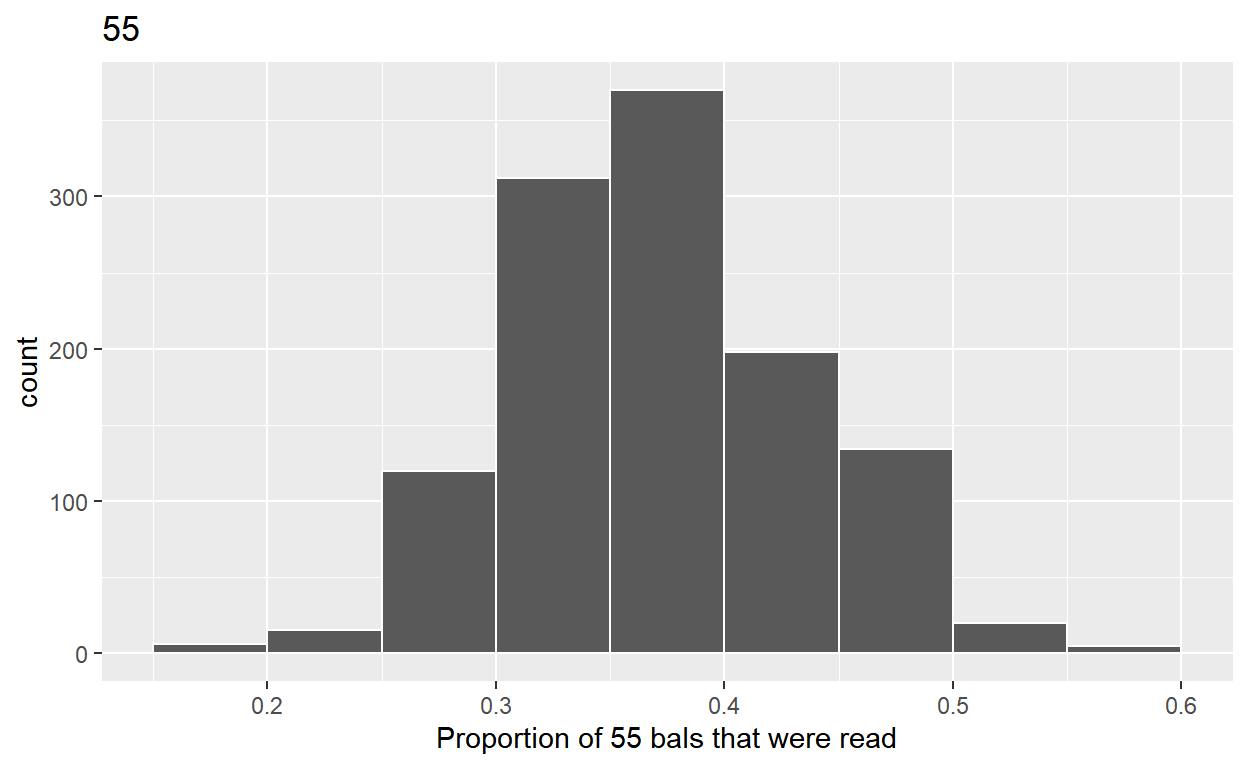
Segment 2: Sample size = 55
2A.
Take 1180 sample of size 55 instead of 1000 replicates of size 50
Assign the output to
virtual_samples_55
virtual_samples_55 <- bowl %>%
  rep_sample_n(size = 55, reps = 1180)
2B.
Compute resulting 1180 replicates of proportion Red
Start with
virtual_samples_55THENgroup_byreplicate THENCreate variable read equal to them sum of all red balls
Create variable
prop_redequal to variable red/55Assign the output to
virtual_prop_red_55
2C.
Plot distribution of
virtual_prop_red_55via a histogramUse labs to:
label x-axis = “Proportion of 55 balls that were red”
create title = “55”
ggplot(virtual_prop_red_55, aes(x = prop_red)) +
  geom_histogram(binwidth = 0.05, boundary = 0.4, color = "white") +
  labs(x = "Proportion of 55 bals that were read", title = "55")
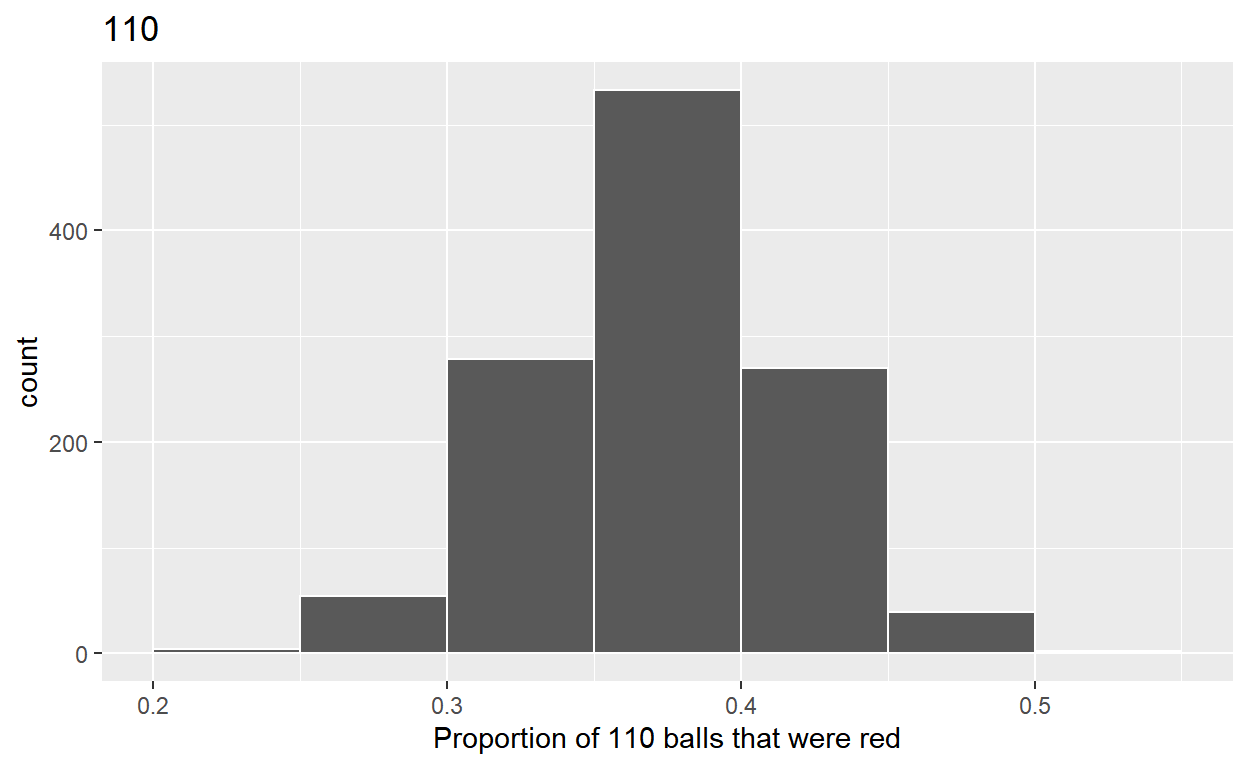
Segment 3: Sample size = 110
3A.
Take 1180 samples of size 110 instead of 1000 replicates of size 100
Assign the output to
virtual_samples_110
virtual_samples_110 <- bowl %>%
  rep_sample_n(size = 110, reps = 1180)
3B.
Compute the resulting 1180 replicates of proportion Red
Start with
virtual_samples_110THENgroup_byreplicate THENCreate variable red equal to the sum of all the red balls
Create variable
prop_redequal to variable red/110Assign output to
virtual_prop_red_110
3C.
Plot distribution of
virtual_prop_red_110via a histogramUse labs to:
label x-axis = “Proportion of 110 balls that were red”
create title = “110”
ggplot(virtual_prop_red_110, aes(prop_red)) +
  geom_histogram(binwidth = 0.05, boundary = 0.4, color = "white") +
  labs(x = "Proportion of 110 balls that were red", title = "110")
Calculate the standard deviation for samples n = 26, n = 55, and n = 110 of 1180 values of prop_red using standard deviation
n = 26
n = 55
n = 110
The distribution with sample size, n = 110, has the smallest standard deviation (spread) around the estimated proportion of red balls.