- Load the R package that we will use.
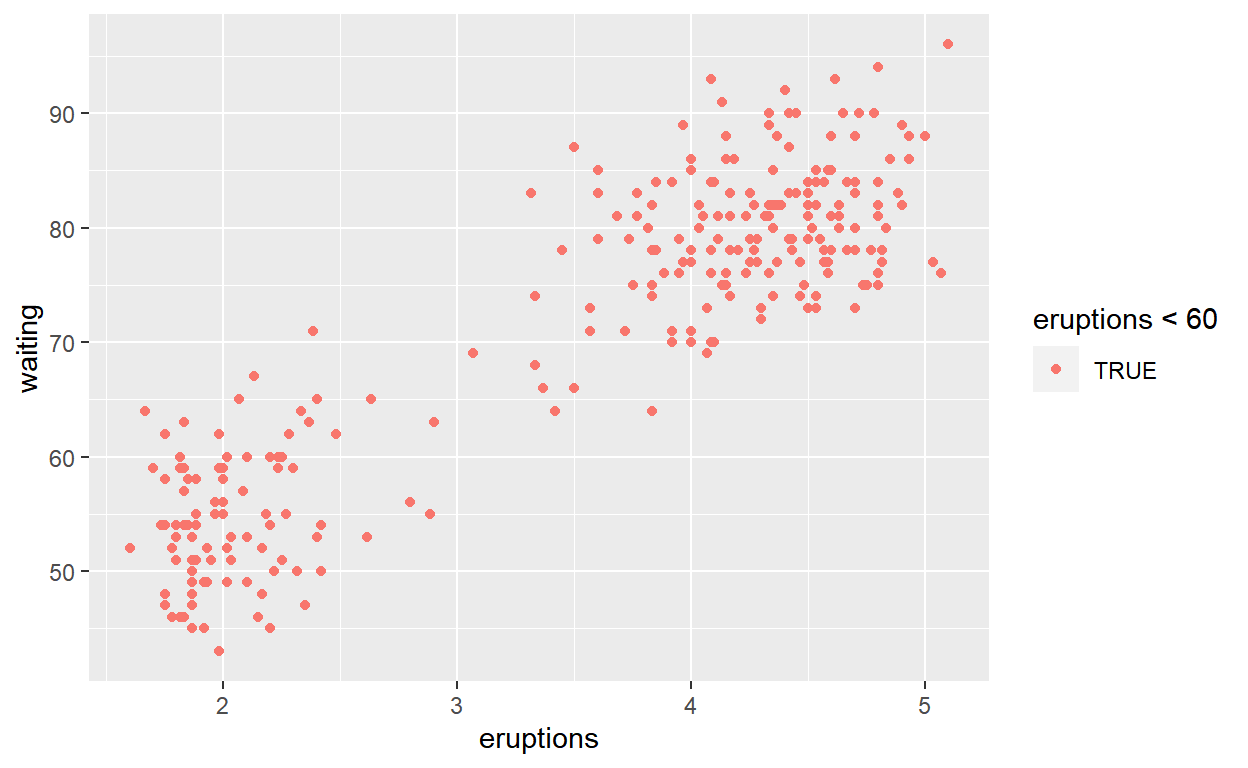
Question: Modify Slide 34
Create a plot with
faithfuldataset.Add points with
geom_pointAssign the variable
eruptionsto the x-axisAssign the variable
waitingto the y-axisColour the points according to whether
waitingis smaller or greater than 60.
ggplot(faithful) +
  geom_point(aes(x = eruptions, y = waiting, colour = eruptions < 60))
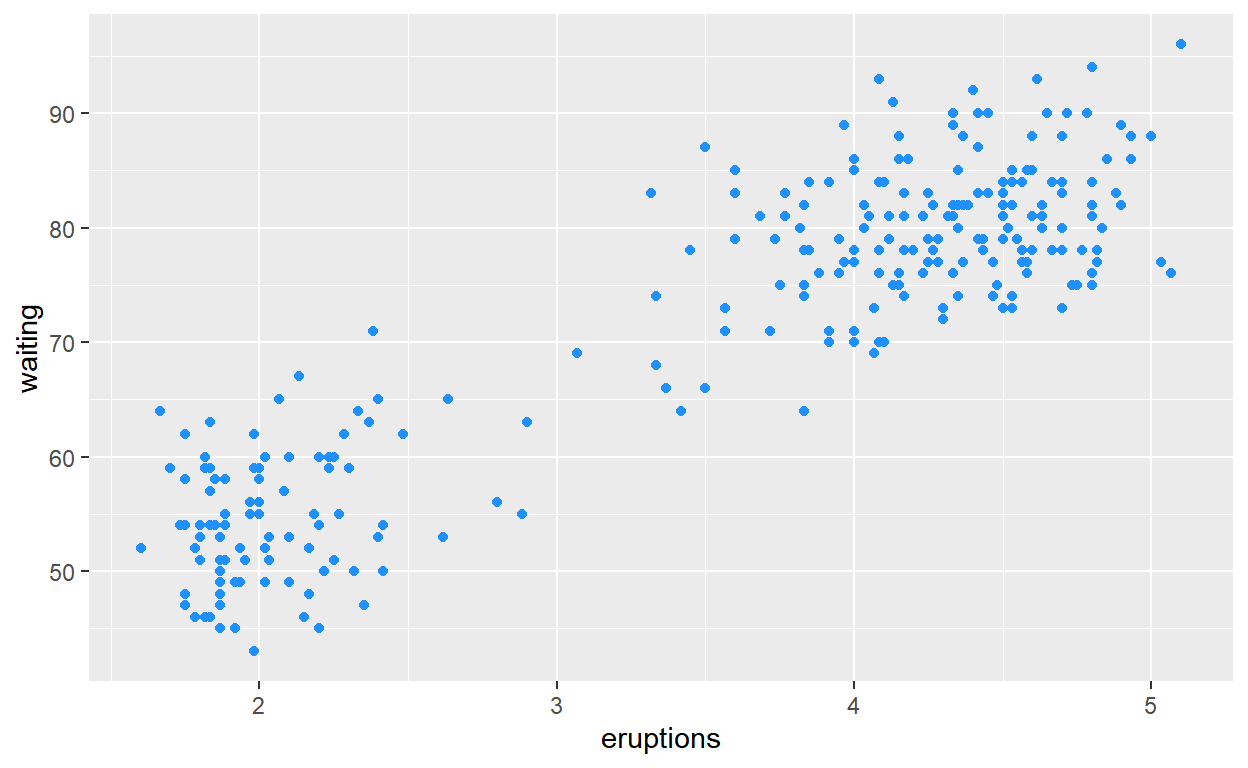
Question: Modify Slide 35
Create a plot with
faithfuldatasetAdd points with
geom_pointAssign the variable
eruptionsto the x-axisAssign the variable
waitingto the y-axisAssign the color
dodgerblueto all points
ggplot(faithful) +
  geom_point(aes(x = eruptions, y = waiting),
             colour = 'dodgerblue')
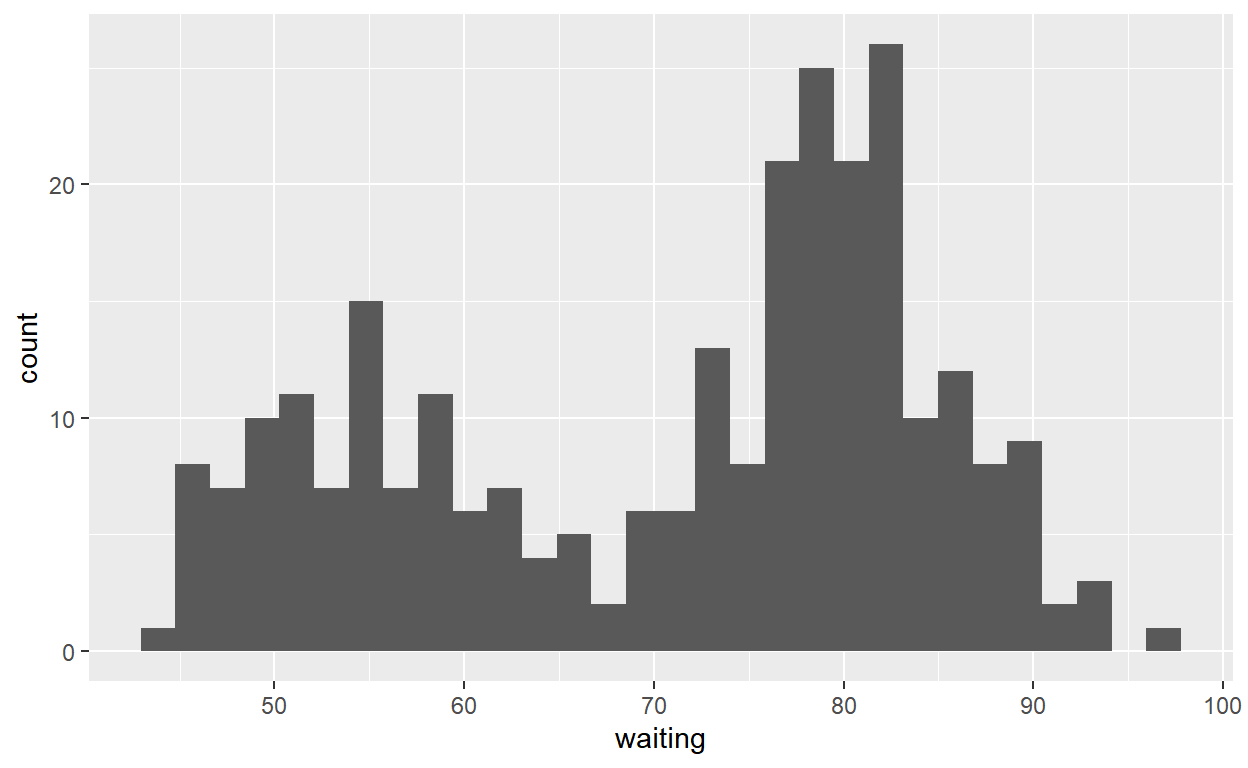
Question: Modify Slide 36
Create a plot with
faithfuldatasetUse
geom_histogram()to plot the distribution ofwaitingtime- Assign the variable
waitingto the x-axis
- Assign the variable
ggplot(faithful) +
  geom_histogram(aes(x = waiting))
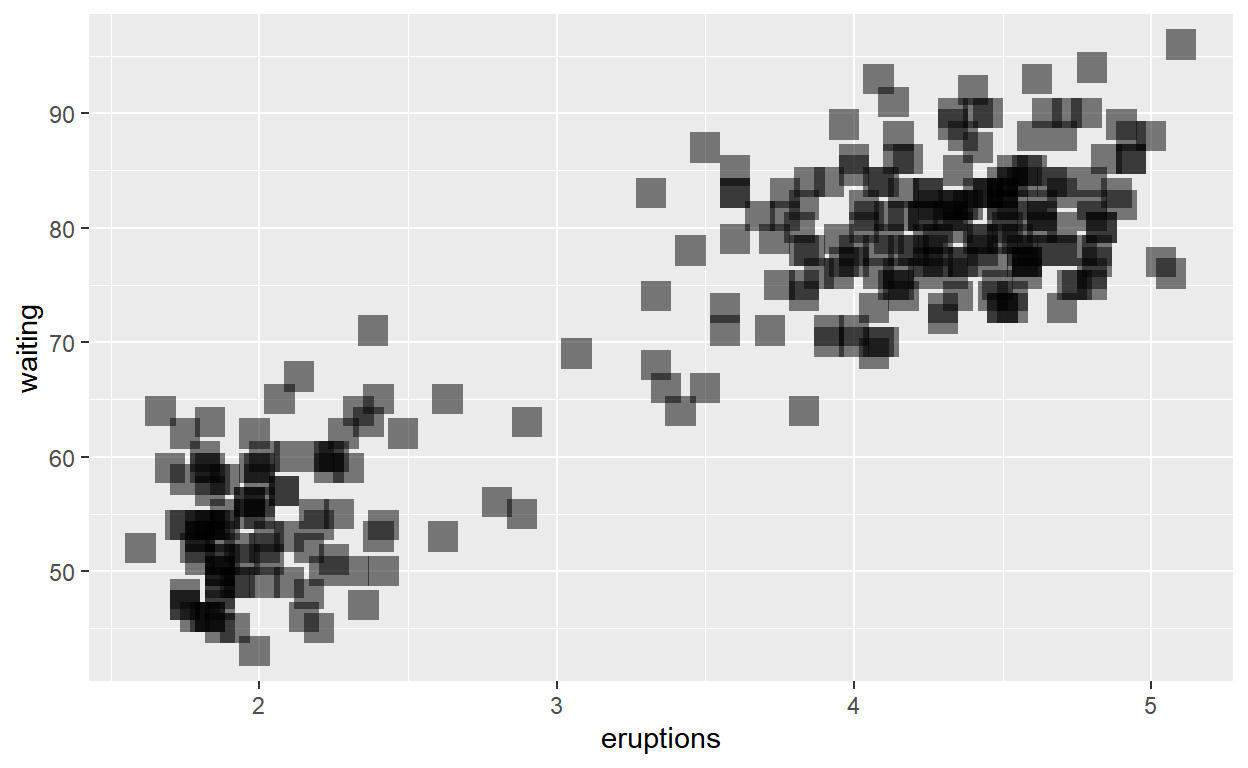
Question: Modify geom-ex-1
Create a plot with the
faithfuldatasetAdd points with
geom_pointAssign the variable
eruptionsto the x-axisAssign the variable
waitingto the y-axisSet the shape of the points to
SquareSet the point size to
5Set the point transparency
0.5
ggplot(faithful) +
  geom_point(aes(x = eruptions, y = waiting),
             shape = "square", size = 5, alpha = 0.5)
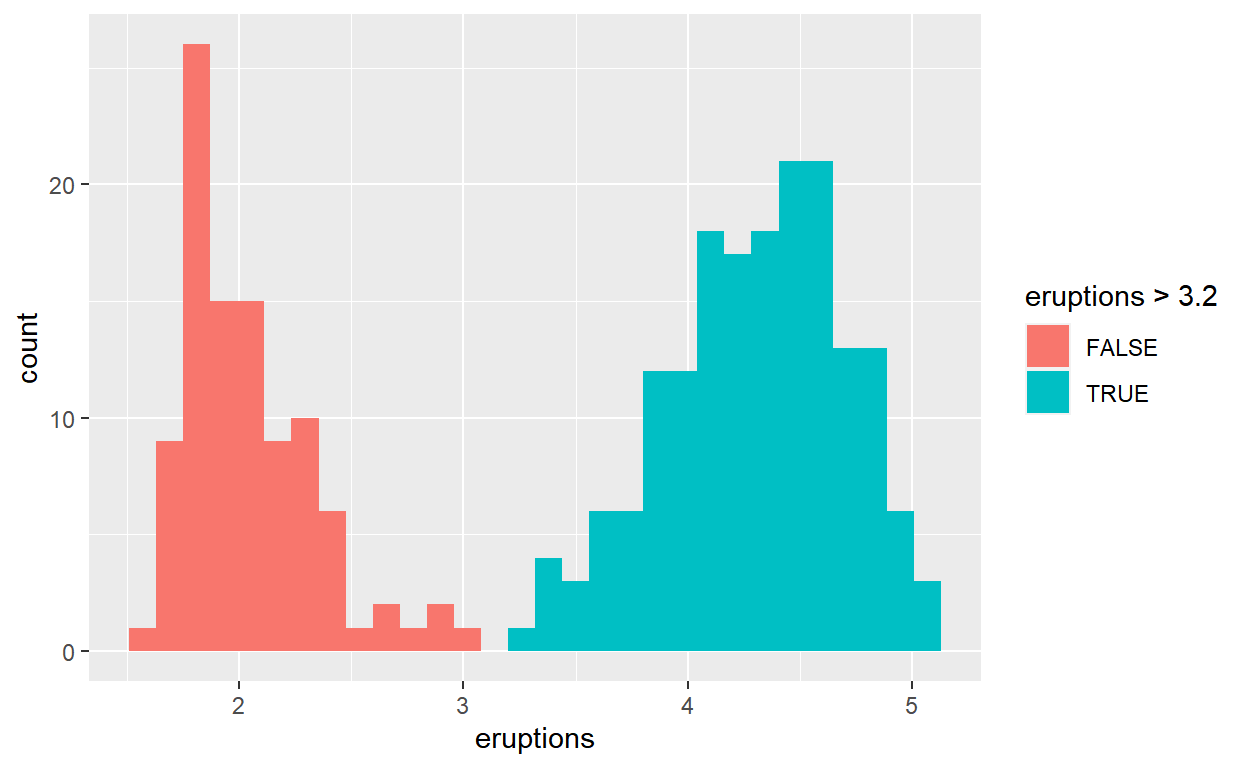
Question: Modify geom-ex-2
Create a plot with
faithfuldatasetUse
geom_histogram()to plot distribution of theeruptions(time)Fill in the histogram based on whether eruptions are greater than or less than 3.2
ggplot(faithful) +
  geom_histogram(aes(x = eruptions, fill = eruptions > 3.2))
Question: Modify stat-slide-40
Create plot with
mpgdatasetAdd
geom_bar()to create a bar chart of the variablemanufacturer

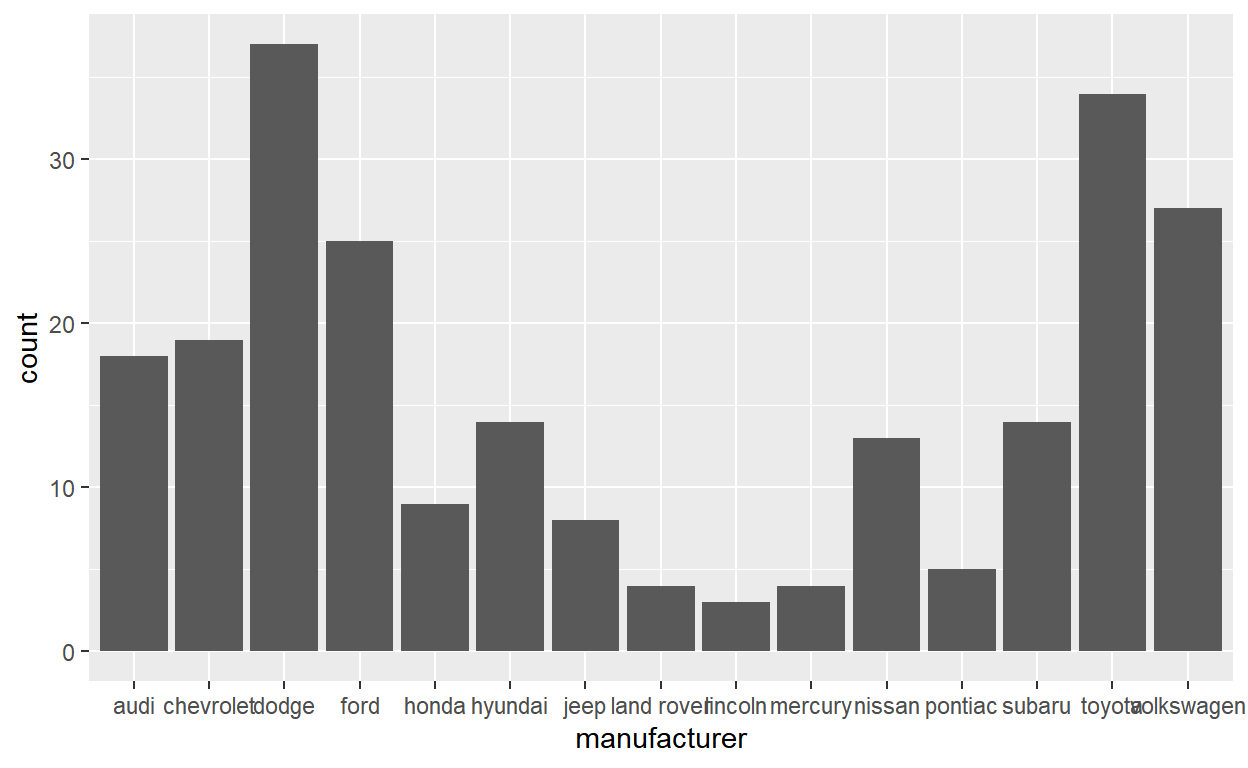
Question: Modify stat-slide-41
- Change code count and plot the variable
manufacturerinstead of class.
mpg_counted <- mpg %>%
  count(manufacturer, name = 'count')
ggplot(mpg_counted) +
  geom_bar(aes(x = manufacturer, y = count), stat = 'identity')
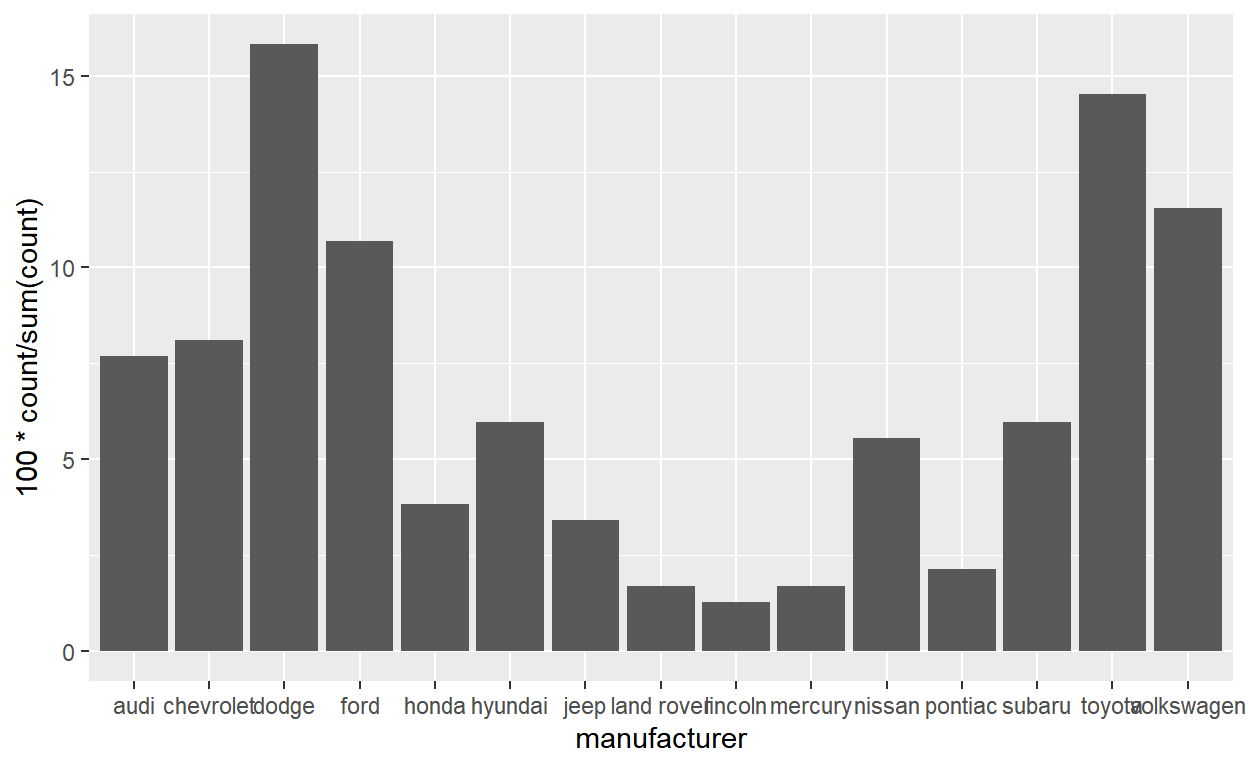
Question: Modify stat-slide-43
Change code to plot bar chart of each manufacturer as a percent of total
Change
classtomanufacturer
ggplot(mpg) +
  geom_bar(aes(x = manufacturer, y = after_stat(100 * count / sum(count))))
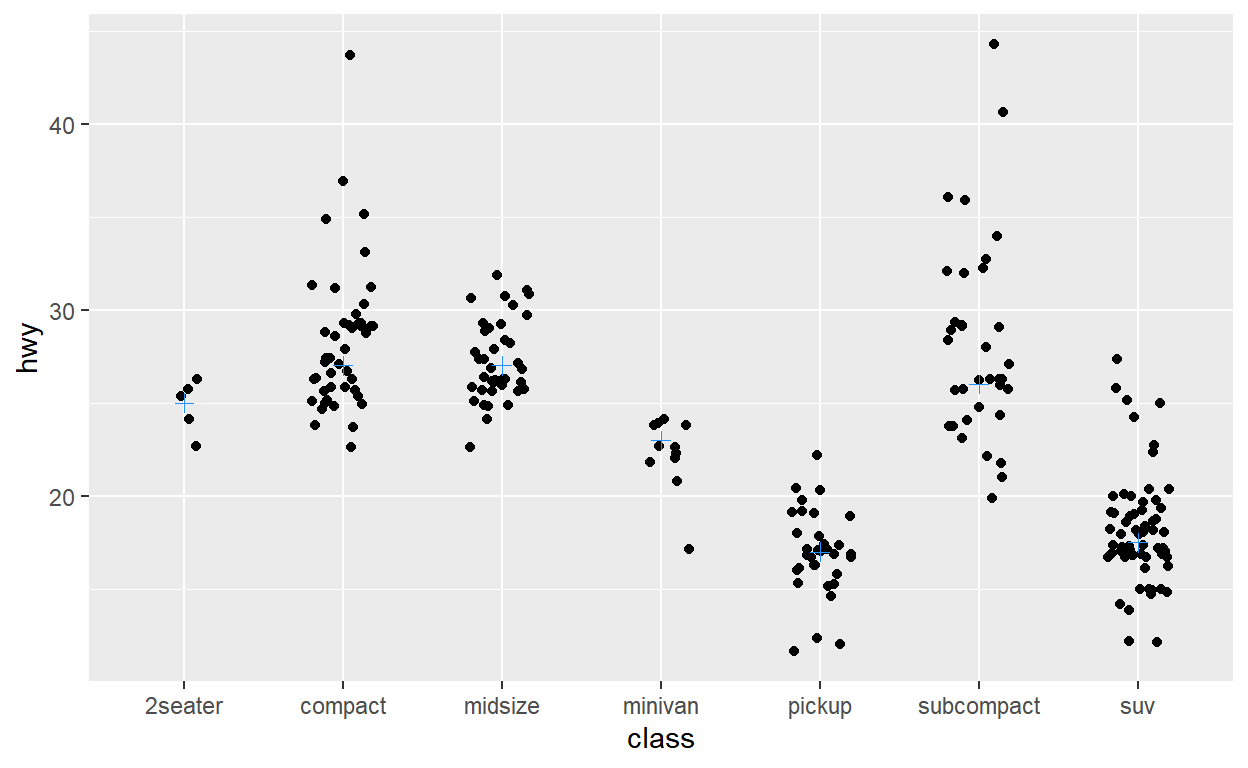
Question: Modify stat-ex-2
Use
stat_summary()to add a dot at themedianof each groupColor the dot
dodgerblueMake the shape of the dot
plusMake the dot size
2
ggplot(mpg) +
  geom_jitter(aes(x = class, y = hwy), width = 0.2) +
  stat_summary(aes(x = class, y = hwy), geom = "point",
               fun = "median", color = "dodgerblue", shape = "plus", size = 2)